|
|
Post by HD Music & Test on Oct 9, 2022 15:02:28 GMT
Well, it's 2022 the big 50's been and long gone life's twisty turning points have made their mark on your truly somewhat indelibly! So I felt it was time to broaden ones horizons a wee bit, so in the last five year or so I have deeply immersed oneself in a much wider spectrum of electronic disciplines, not just for audio as I perform many other designs outside of that particular area of expertise. A large part of ANY electronic product is the power supply, from AC to DC and way beyond now, it's not just a case of buy a Transformer, slap i a full bridge some big caps and hey presto a top of line power supply . Many devices use multiple power rails, with varying voltages and current draws. Some are switch mode, (these have their uses, small form, lower component count, high power density factor (more grunt per square mm!) However, these require a PDN (Power distribution network) basically a small dedicated micro controller to do all of the sensing both V + I) and make the necessary calculations and perform the 'trimming' in real time. A great many regulators now are a type SMPS buck/boost (plus more sub categories as well) as well tradition linear regulators. Power supply measurements have become far more complex and in depth than just a mere DVM can handle (Digital Volt Meter), not just looking at AC line power quality (I have four independent methods of integrating both single & three phase electricity via dedicated power analysers and Oscilloscopes, probes & specialist software. So test & measurement equipment hasn't escaped the snow flake era, we now all have 'apps' for the scopes, wish to look I2c/UART/SPCI etc, oh serial decoding app sir, that will be £$£$£ lol. Wish to look at audio I2s/TDME/left/right justified (These are audio digital serial ata protocols in which the sound travels between box 'a' & box 'b' ) certainly sir that's another £££ This is one of the more of the more recent app's I have acquired Digital Power Management and it is incredibly useful for all aspect of my work. It has such an in-depth ability to 'view' exactly what happens to a power rail when in use, at idle, partial load or initial start up. I can view up to 16 different individual features of the rail at any one time, not just current power level (a current probe is also required to measure current at the same time) "Need a accurate current probe sir we have a stunning 1Ma resolution and 100Mhz BW probe yours for a mere £7K (plus vat)” Oh don’t forget the RP 4030 voltage rail probe that is capable of 0.5% gain accuracy with your 12 bit a scope sir that will be another $£$ sir lol In layman’s terms fricking amazing.
This is the sort of information I can see displayed.
It might look like a lot of squiggles and coloured patterns but it's incredibly useful and tell me as great deals about the state of that power rail and what influences are affecting it. The scope I use also has as great ability as well, I can also view these results in the frequency domain on a spectrum analyser at the same time, on the Lecroy scopes you can view 2 individual spectrums at once another great insight for looking at noiase on the power rails These are some examples here looking at a very highly regarded pre amplifer output being fed with as pure 2V rmas 1Khz sine wave via an exceptionally decent function generator, as you can see, the channels are superbly matched with as deviation of 55 millionths of as volt between them!  Need to measure AC in and AC out? oh you will need two of each sir! Guys seriously if you feel audio is expensive trust me it pales into almost insignificance compared to the cost of the accessories for test and measurement equipment. Now this is another 'app' you require to delve in to ASC investigation; Power Analyser
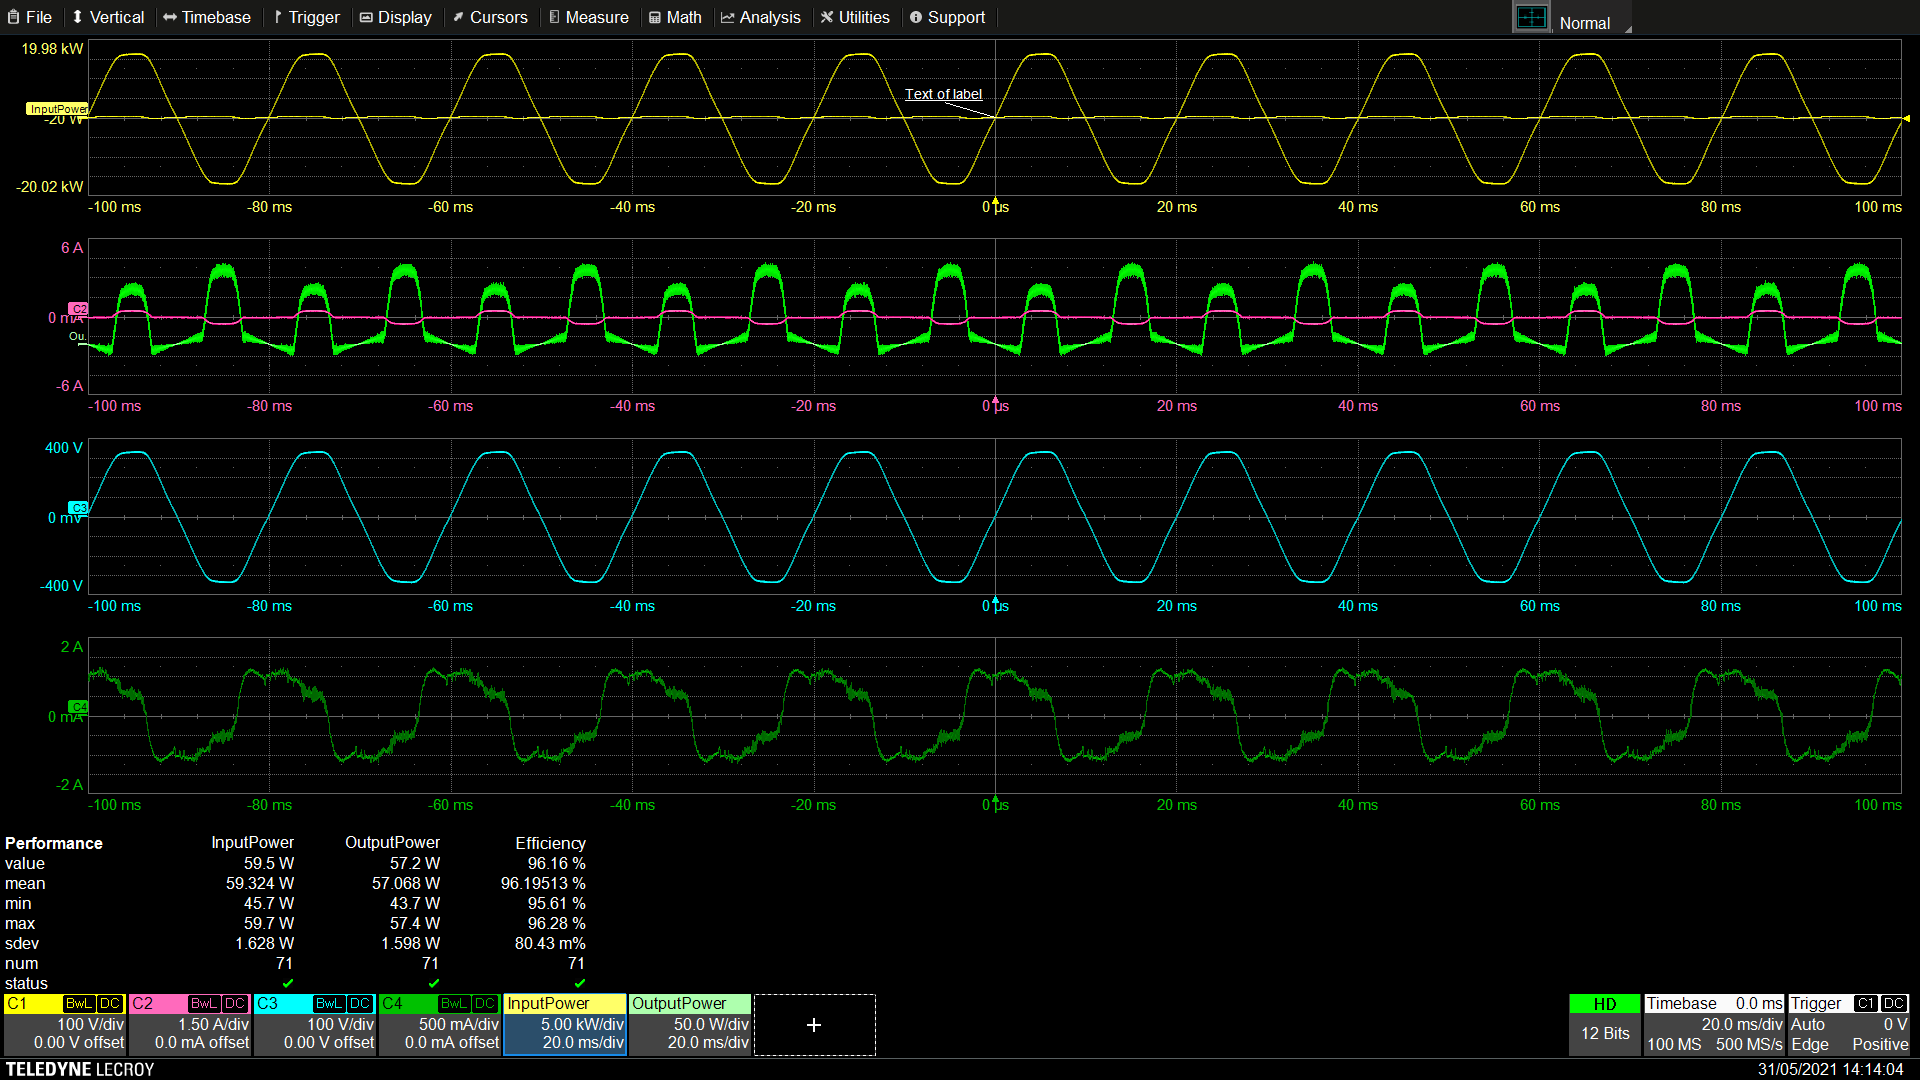
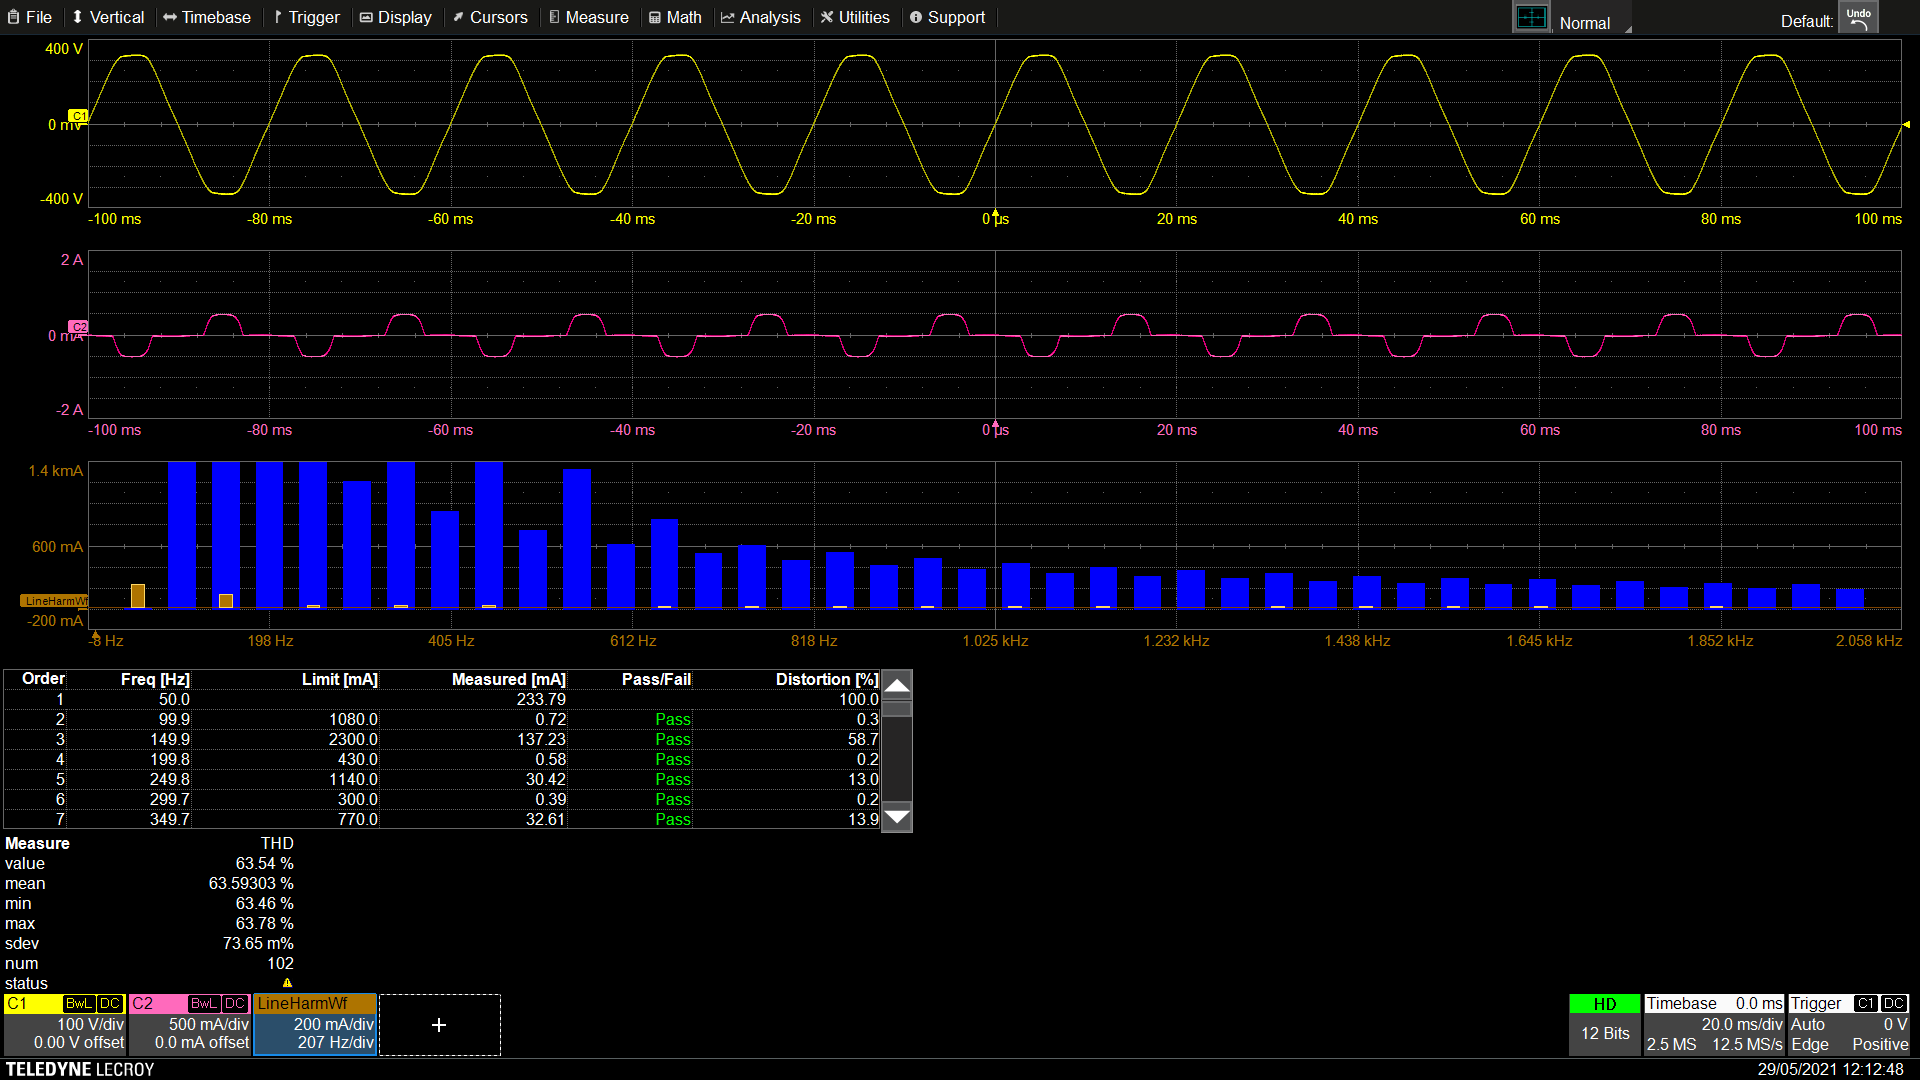
Some examples below of AC measurements of an AC filter design with the harmonic CISPER 16 (CE home electronics standard) being viewed this is looking at before & after as mains AC filter, followed by harmonics
Enough techie for now!
Power analysis for both ac & dc ias absolutely essential for ANY form of electric design/ repair imho it is the best grounding blocks you start with for correct electronics engineering.
Just wished to give you as brief insight in to how I go about the profession I occupy
Next installment the equipment involved
|
|
|
|
Post by stellabagpuss on Oct 9, 2022 16:53:24 GMT
Excellent post Tony, although l have to Re Read it to digest it properly.
Damien
|
|
|
|
Post by julesd68 on Oct 9, 2022 17:22:37 GMT
Yes it looks excellent and erudite in equal measure. Sadly one of my greatest achievements in life was the inexplicable award of a grade B for O level physics, which gives you an idea that the details in Coherent Tony's post flew some distance over my dome. The pictures looked great though.
|
|
|
|
Post by stellabagpuss on Oct 10, 2022 20:34:32 GMT
l guess it would be good to show one good measurement and then a bad one, with some arrows to briefly explain what we should be looking for.
|
|
|
|
Post by MartinT on Oct 14, 2022 11:04:16 GMT
Looking forward to more installments, Tony.
If you can do one on ground plane noise and the effect of grounding boxes I know that would be most helpful to those who still haven't had the urge to try one.
|
|
|
|
Post by HD Music & Test on Oct 14, 2022 11:18:52 GMT
I have a series of them planned, test equipment with how and why we use next though
After that some practical experiments of what we see and how it relates to the real world.
|
|
|
|
Post by ajski2fly on Oct 14, 2022 12:17:27 GMT
A great post and like others my knowledge and understanding of electronics is limited, would be lovely to have good to bad examples and brief explanation of why, cause/effect. Very interesting.
|
|
|
|
Post by HD Music & Test on Oct 14, 2022 13:06:15 GMT
Tomorrow if I get time, I'll put up about a well known TAS Gustard Dac A22 before measurments and explain what they mean and you could interpet them but right now I have a Nagra HD dac thats requires some TLC
|
|
|
|
Post by HD Music & Test on Oct 15, 2022 13:54:30 GMT
Damien, He is a brief video illustrating how we can 'look' at the various types of noise on any given power rail, its concise and to the point, but it shows the perspective well. Later some more basic test sets and tools
This demonstartes the importnace of correct probe selection for consistance accurate signal integrity repeatable measurements, Ken's a nice guy but he is a salesman!
|
|
|
|
Post by stellabagpuss on Oct 15, 2022 22:41:14 GMT
That's some kit there using, and a interesting videos Tony.
l get the point, although some terminology is lost on me, but it's really interesting.That graphics overlay on the noisy power rail is a great tool.
|
|
|
|
Post by HD Music & Test on Oct 16, 2022 0:12:52 GMT
Some basic but very useful information now that will help you with whatever you E project is, even with the wealth of test equipment here in the lab, imho the most important and ultimately useful single piece of kit is the humble multi meter / digital volt meter. Its presence here in the lab cannot be understated. You see it's really multiple instruments in one smallish box (if a hand held version), we even used these (or a more primitive analogue versions at school in the science labs!) yes really even that far back in time humans were using them  We used these Avo's in the late 70's and they were a good 12 years old then, but still pretty much cutting edge however all the Macintosh boys will have silkie juicing session with the big analogue dials  (though NO blue lights!)  So, it’s not just a voltage measurement device, oh no there's more! You can purchase a DVM from the bay of fleas or that well know long tributary in South America for as little as £10, how accurate and reliable this is well, you get what you pay for in this world I believe.
You can pay up to £600+ for a decent hand held from Fluke or Keysight.
However these days a quality meter is around £150ish and will sport the following abilities
Digital voltage meter for both AC & DC usually up to 600A/C and 1000Vdc (the test leads need to be checked that they are Cat III rating/ Cat II is domestic 240Vac)
Millivolt ranges for both ac/dc
Resistance measuremets upto 10 meg Ohm (again depends on meter spec & cost)
Continuity testing (beep fuction to test circuit pathways)
Diode testing which if you can also test PNP & NPN transistors as well a FET's Source / Gate / Drain not 100% but its pretty useful.
Current meter both mA & Amp rating usually up to 10amp with the internal fuse rating. (This is performed in series and requires different test lead configurations)
They can also show a frequency as well.
Plus other options depending on your budget and size of your hands!
These DVM's are a superb tool for basic fault finding and indicating if your project is actually producing the goods according to the build schematics I have a significant number DVM of various types in the lab, (like Wadia's one cannot have enough DVM's!) I had a count up earlier it was surprised but not so to speak. Three traditional hand-held devices as most people would recognise, two bench DVM one 6.5 digital accuracy & one 8.5 Digital accuracy which is a meteorological grade instrument. Each of the power supplies I have (both DC & AC) have very accurate V + I meters plus a power meter (watts) built in I have six of those, a couple are three rails plus doubles and singles. Two dedicated power analysers and four oscilloscopes. The Lecroy scopes also have a pleathora of specialist voltage rail and current probes that can used on each channel. Oh ans the Rhode & Schwarz UPV audio analyser has a nice set of DVM's built in as well.
So with all that build up, they must be important, well YES essential I would suggest, even with my diagnostic capabilities a DVM is the first instrument I go to its that simple.
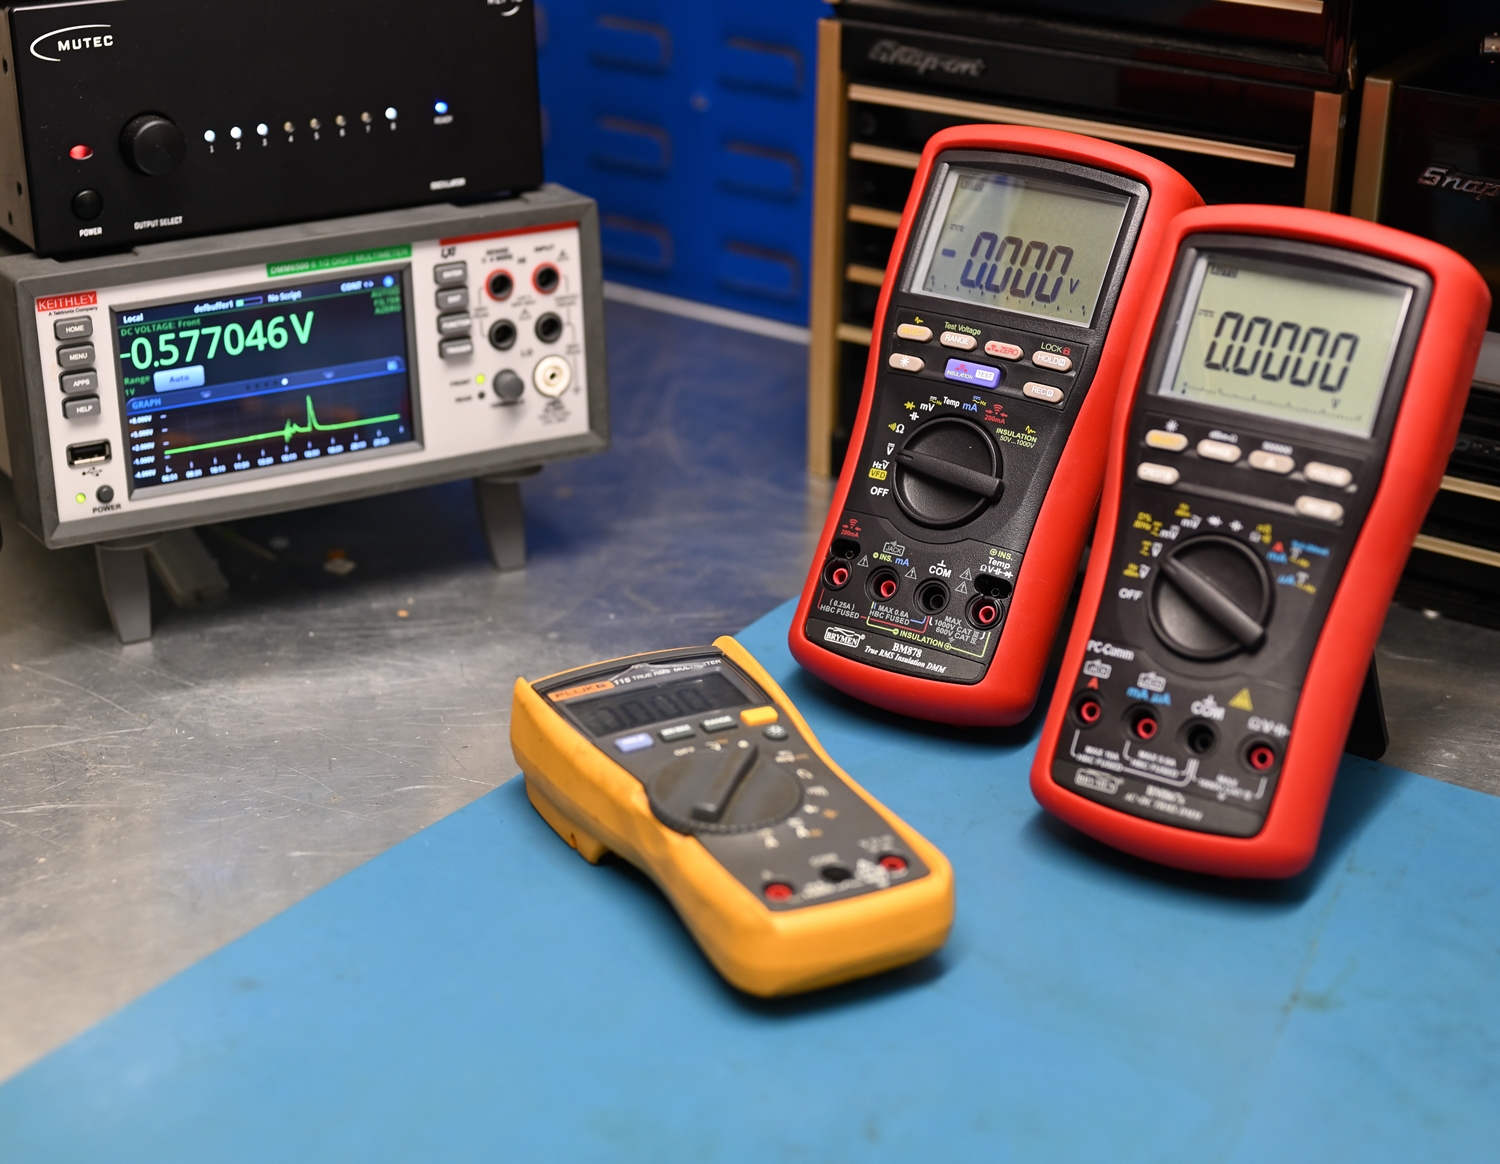
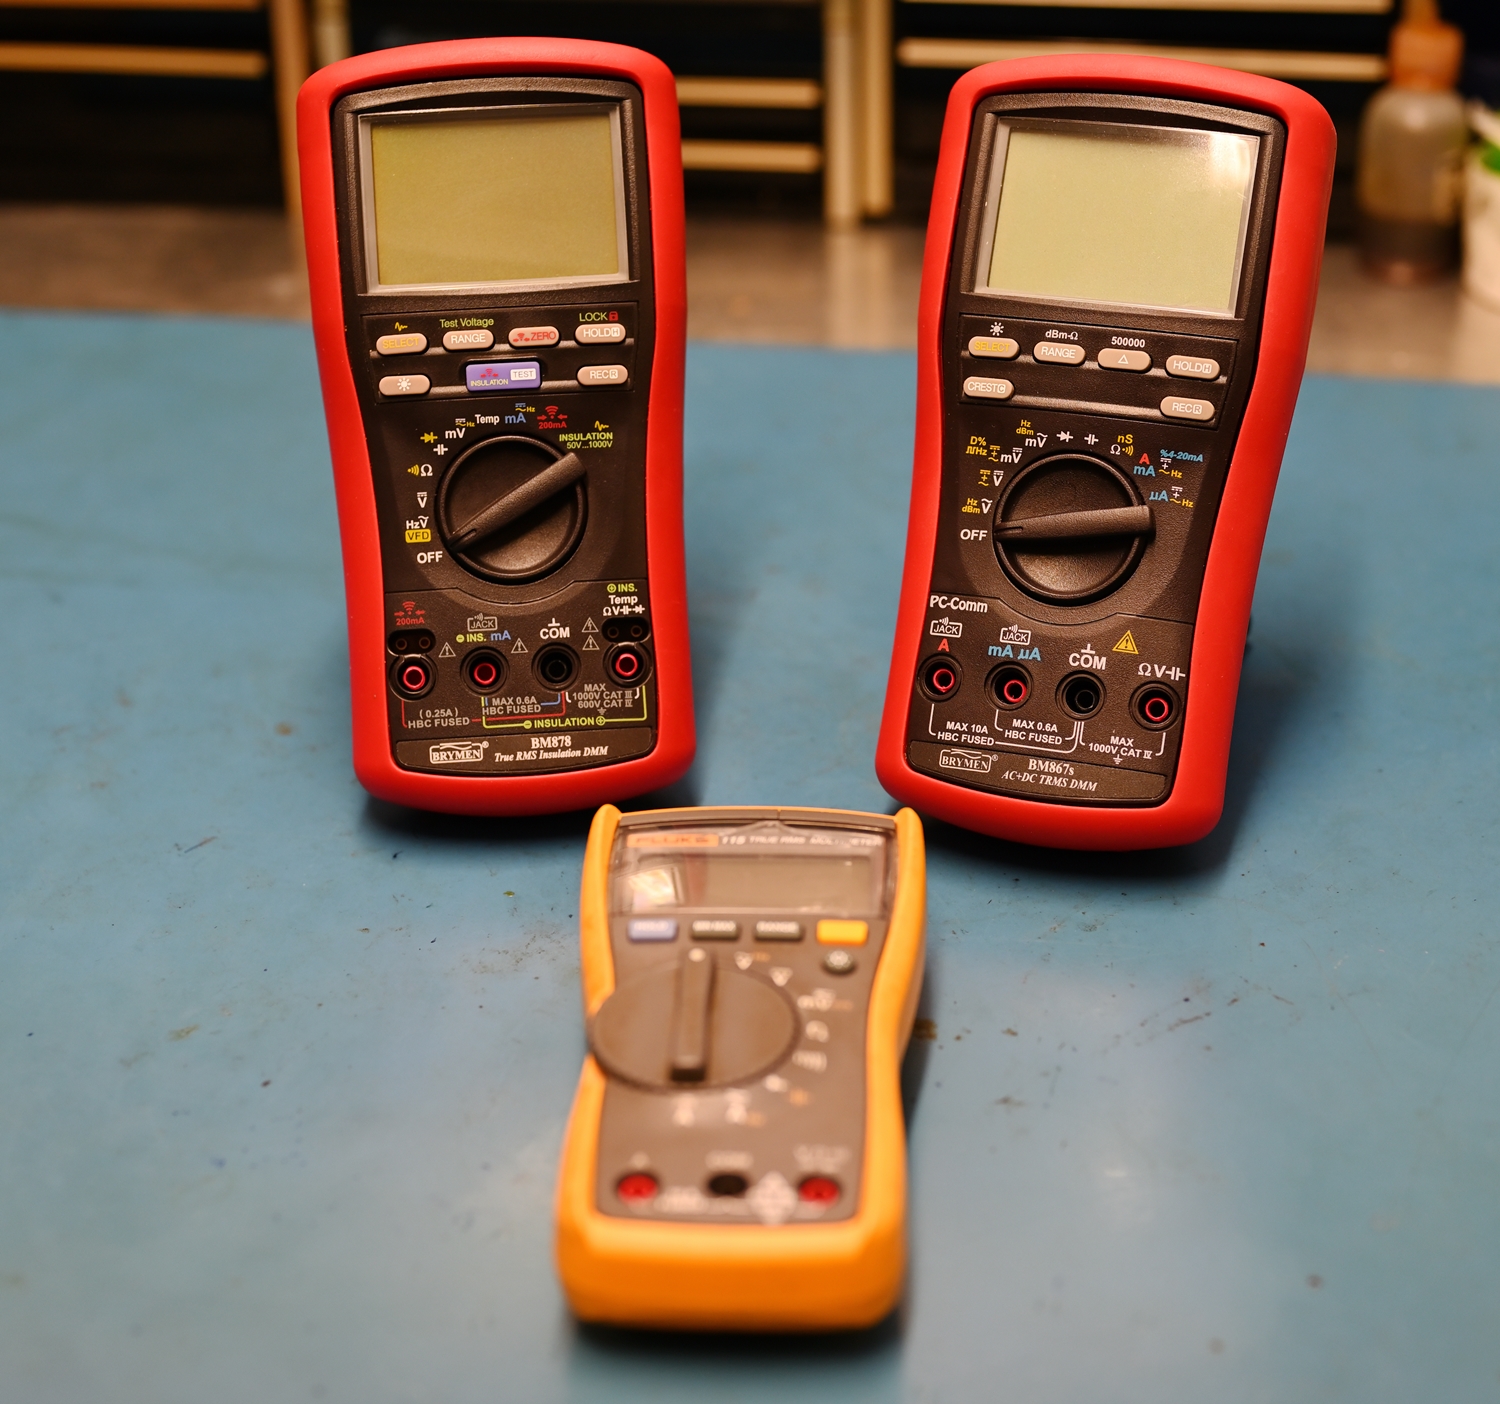
Examples of hand held DVM's
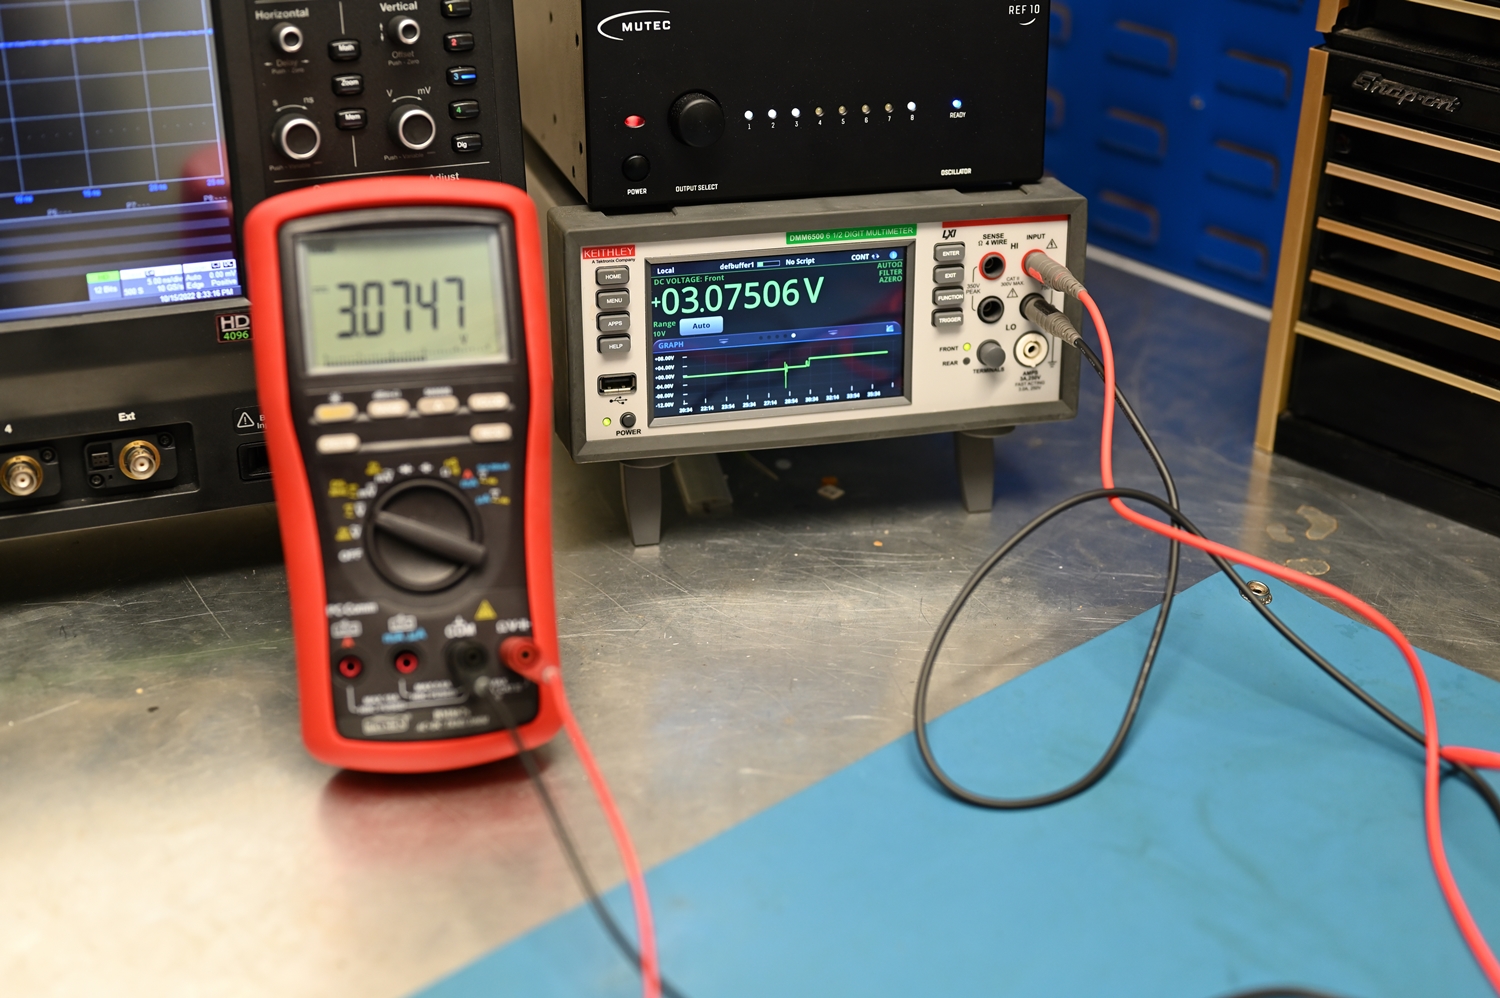
Hand held DVM's next to the ubiquitious bench top model with a graphical touch screen display, and some rather natty features  Its also very accurate and stable plus has a four wire ability to make even tighter measurments when required it also has a temprature feature as well.
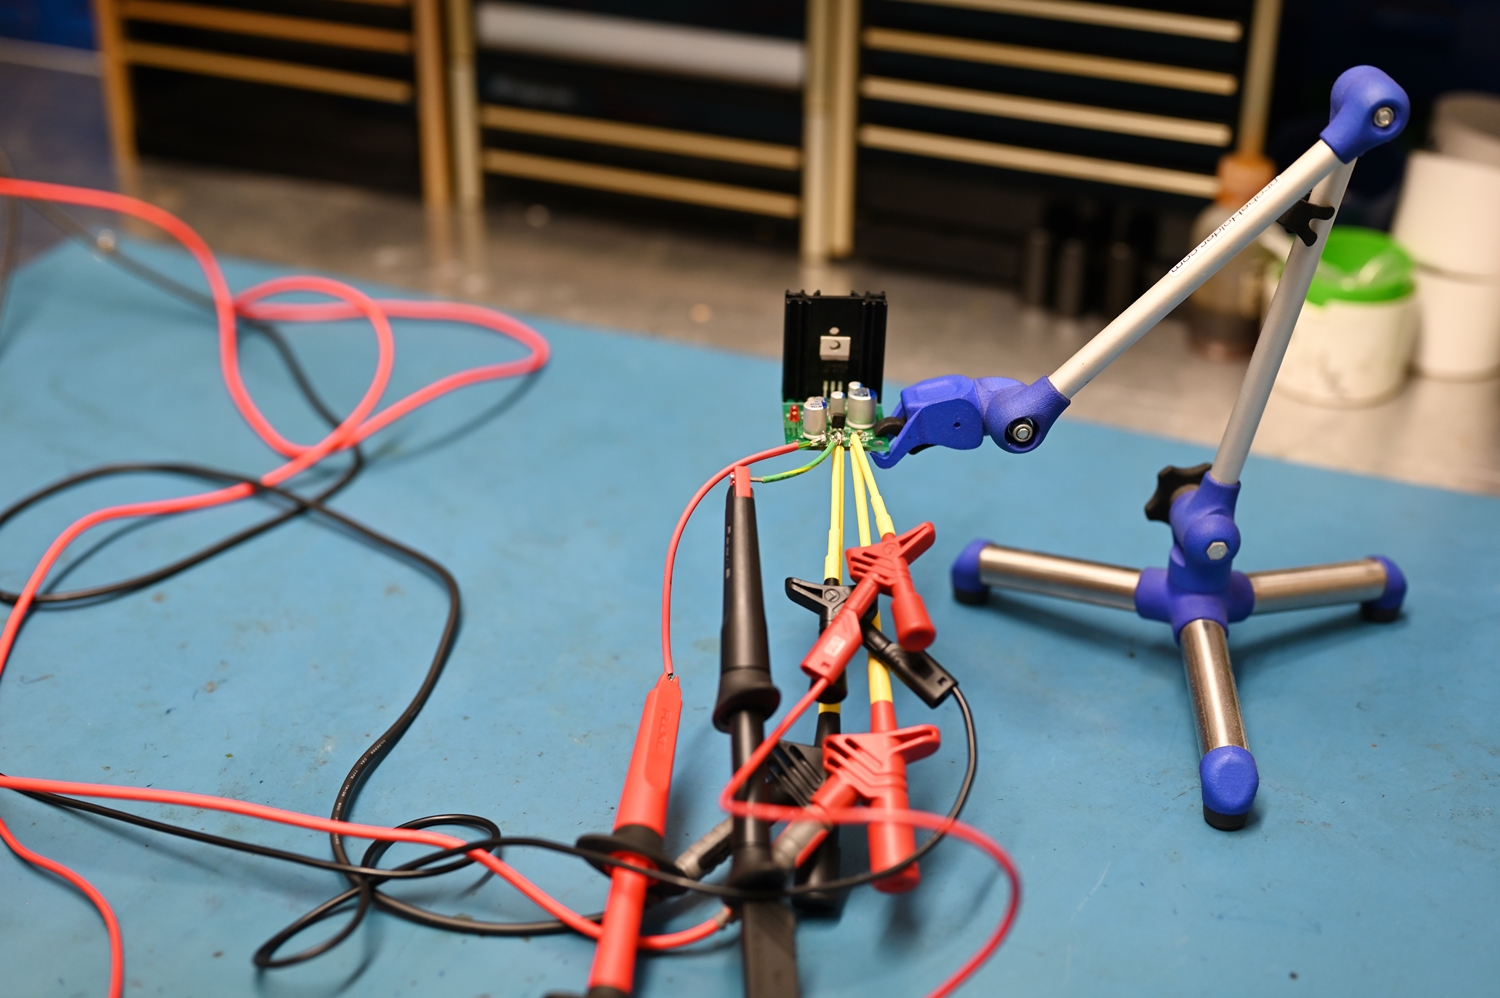
I found an old regulator in one of my spares and interesting draw so I set up this basic test so you can see how various methods can be used to achieve the same result as in measuring voltages. The image below shows regulator suspended by a probe holder (novel use number 23 lol), with the two large gripper clamps supplying 12 Vdc in on the left-hand side and centre pins on the reg.
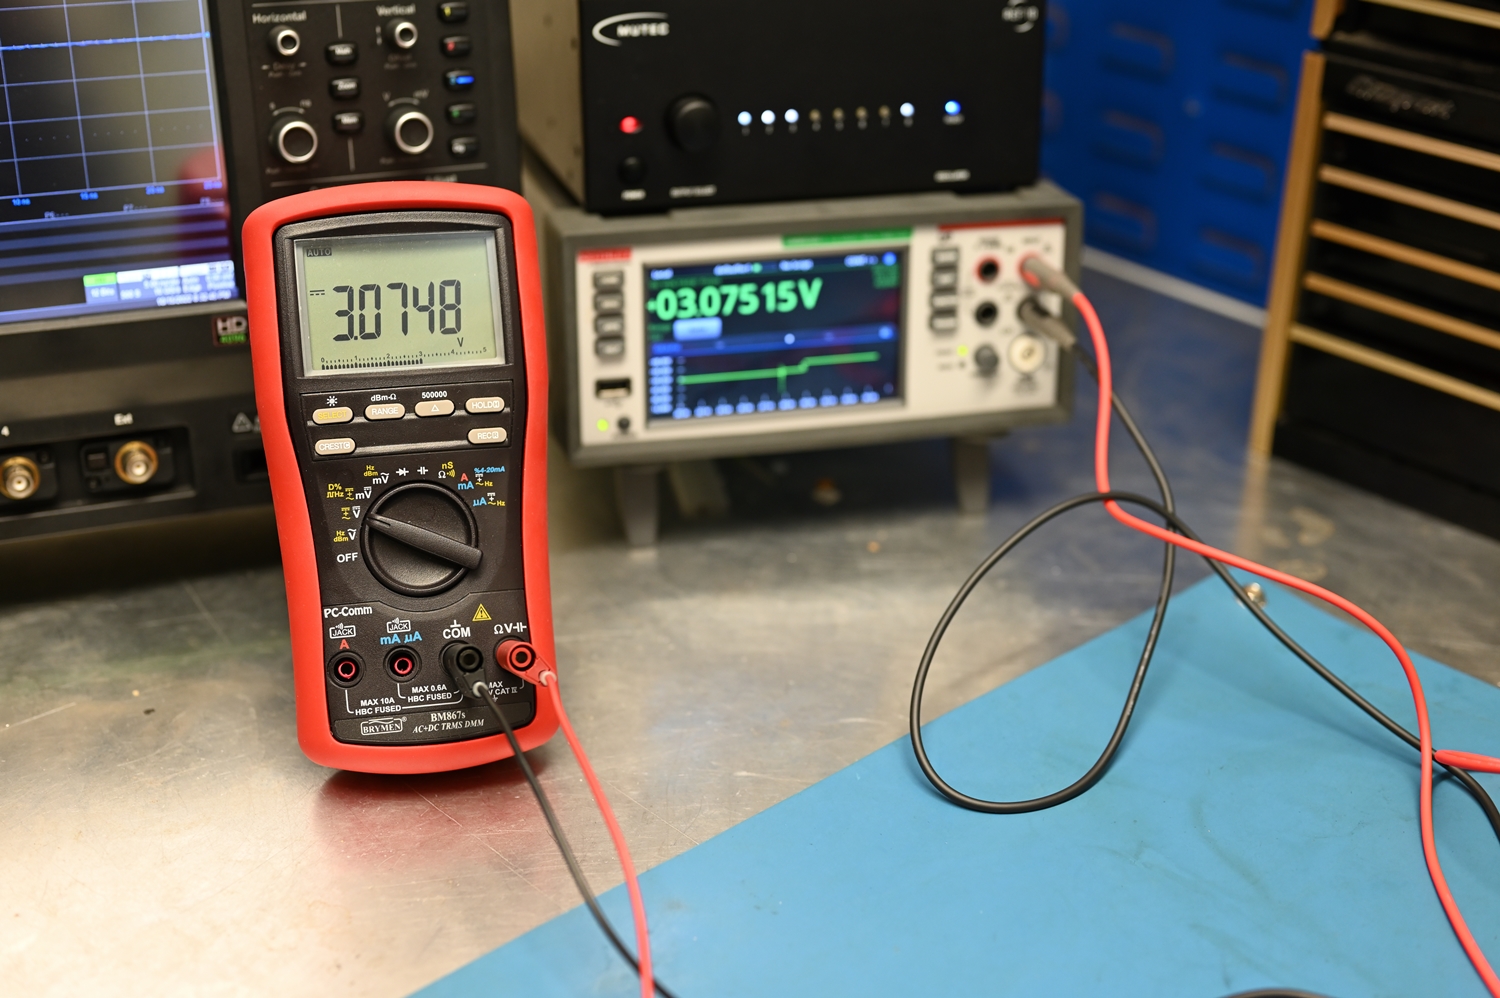
The two set of grippers are connected to both DVM's at the same time. Now this could generate a loading issue (possible false readings) along with the length of the test leads and the diameter hold good a 'fit the grippers are located on the posts etc all these variables can cause incorrect end results. Yes, really when are dealing with millionths of volt, then temperature, lead impedance, clamp/ probe fastenings / how long the instruments have been on all have an effect on the final figure. We call this Signal Integrity Awareness. You have to have confidence in your instruments and your own ability to set up the experiment correctly and repeatable.
Expect to see what you expect to see, if not then there is a problem with the kit / operator / procedure.
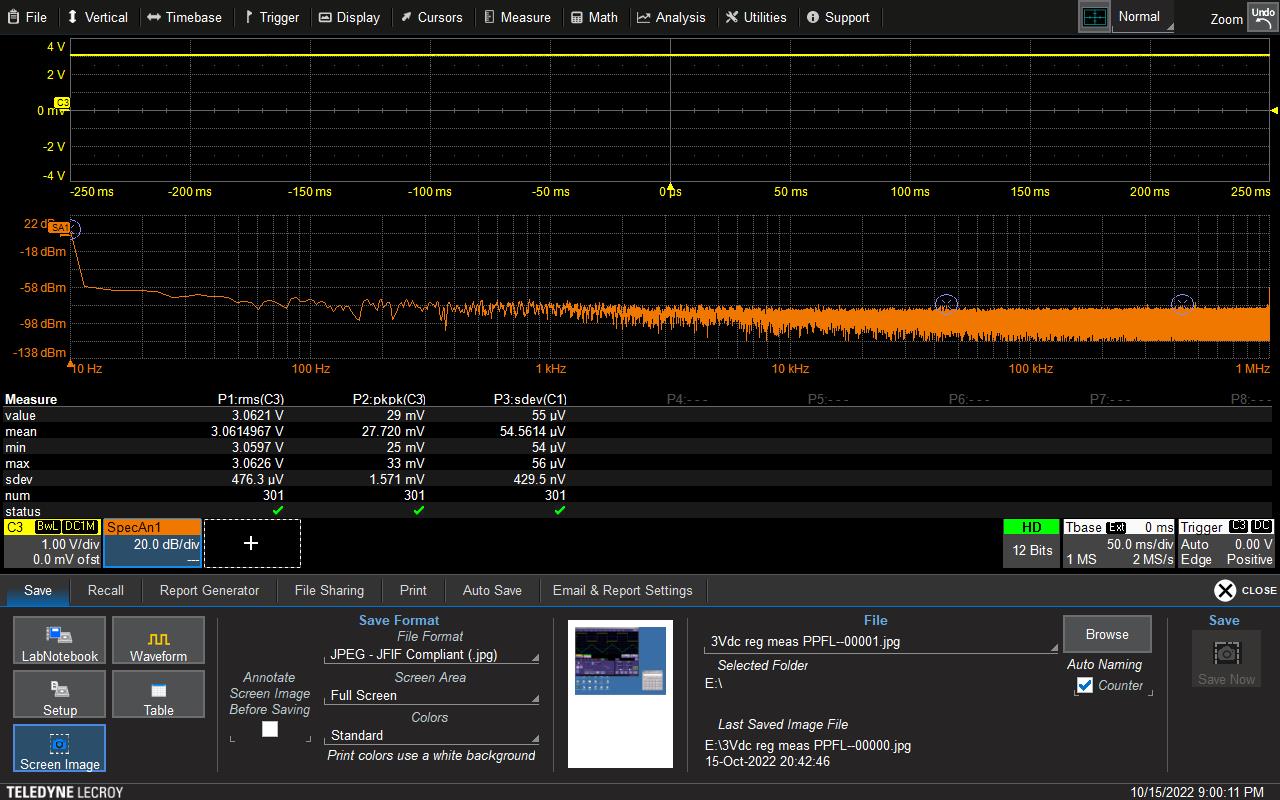
For example, below I would expect to see 3Vdc +/- 400uV variation (ripple noise) with the psu and rough set up we are using If we saw 600+uV or under 20uV then I would immediately suspect a problem.
Basic test set up
Below you can the infocus red hand held DVM indicating its readings (its a rather good 4.5 digit instrument) and in the back ground the DM6500 delivering its verdict, the image below this also gives you a much clearer viewe of the bench DVM,
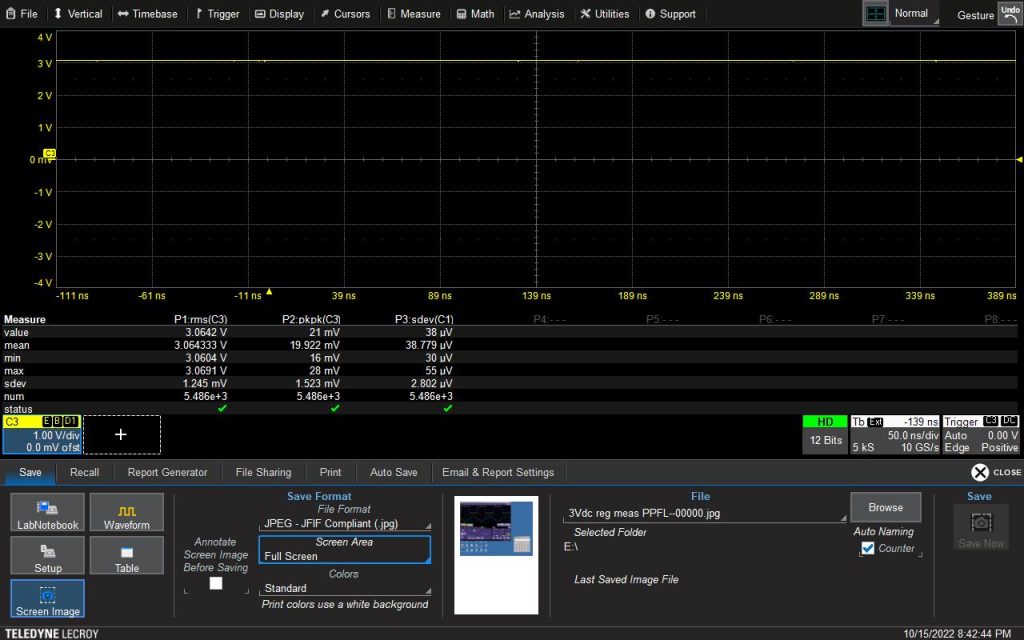
With the image below, I thought it would use the Lecroy 12-bit scope to demonstrate its ability to look at power rails, now you can see the standard passive 500Mhz probe being used with the ground lead attached to the reference voltage (middle pin) and the probes 'Witches hat' attached to the output voltage pin. Now this is not the best method of making a really accurate measurement, (you could use the spring clip to reduce the impedance pathway instead of the ground clip) different probes etc that's for a later instalment. However, most novices use this method its not wrong, but it could be better. That said I have taken of a couple of scope screen shots, the first shows a straight line (lol) well it is DC! and below are the measurement parameters I set up to illustrate how accurate this scope is. You can see the RMS (Root mean square) valve (real money value) The Peak-to-Peak reading (max to min) and the important one STD standard deviation how much it really moves about. Thinking about it I should have done a zoom shot and shown the amount of movement from the base line value. (Next time) The second images also has a second trace with the spectrum analyser on which also shows the serious lack of harmonic noise sitting on the rail. This was just a quick & dirty basic set up, but I feel it shows in respectable detail what and how we look at DC power rails at first investigations. Next up current and voltage measurements and correlations to other components in the circuit and how they can affect the end result. Oh, the result of the measurement was a Std of around 475uV so pretty close to what I would expect with this DUT (device under test) so I am satisfyied for this Saturday afternoon test it was in the zone 
|
|
|
|
Post by stellabagpuss on Oct 16, 2022 6:50:32 GMT
Wow...
Thank you Tony,for taking the time to explain this in basic terms, l am sure other TAS members will find this interesting.
l know your a busy guy, so thanks again.
|
|
|
|
Post by MartinT on Oct 16, 2022 8:46:52 GMT
I used to have that exact same Avometer model when I was a computer service engineer. Then I was given a Fluke DVM - lordy, that was a good instrument. In my final year I was given a Tektronix dual-beam oscilloscope and that was fantastic! Nowadays I have an ageing oscilloscope and two DVMs. Here's an old photo of them in action when I was modding my Technics turntable with Paul Hynes regulator modules.  |
|
|
|
Post by petea on Oct 16, 2022 11:37:07 GMT
Thanks, Tony. Interesting. A small question though. Is Num the number of samples taken to produce the mean and standard deviation? If so it is interesting that the standard deviation of the measurements of voltage taken with 5,500 samples (first reading) is larger than when 301 samples was used. As these measurements are taken over time, does that then suggest that there is more variation in voltage, but with a longer periodicity, than indicated during the shorter sampling 'window' (I assume that the sampling frequency was the same) - voltage drift, etc?
Actually I think I might have just answered the question myself if I am reading the screens correctly: the first reading was done using 10 MS/s whereas the second was done with 2. If that is the case then does that mean that the variation observed (albeit small in range) is at a shorter periodicity than indicated by the first set of observations?
As an aside, a friend has a fairly large collection of old Avometers (he is a broadcast engineer by training and so I guess it is a bit like me with cameras and microscopes!). He gave me one a while back that came in a batch he'd bought as it was marked as having come from one of the old ICI plants and has their old orange livery (and I worked for ICI for 20 years). I don't use it, but it does sit on display in the workshop!
|
|
|
|
Post by HD Music & Test on Oct 16, 2022 16:08:05 GMT
Thanks, Tony. Interesting. A small question though. Is Num the number of samples taken to produce the mean and standard deviation? If so it is interesting that the standard deviation of the measurements of voltage taken with 5,500 samples (first reading) is larger than when 301 samples was used. As these measurements are taken over time, does that then suggest that there is more variation in voltage, but with a longer periodicity, than indicated during the shorter sampling 'window' (I assume that the sampling frequency was the same) - voltage drift, etc? Actually I think I might have just answered the question myself if I am reading the screens correctly: the first reading was done using 10 MS/s whereas the second was done with 2. If that is the case then does that mean that the variation observed (albeit small in range) is at a shorter periodicity than indicated by the first set of observations? Peter Third time replying to this  Normally I would take a greater number of sample size usually around 500k plus but as it was a quick & dirty set up I moved the HTB (Horizontal Time Base) out to 50 micro seconds the amount of information in a single aquitision is significantly more than @ say 10 nanoseconds. Also remember the sample rate was 10 billion points per second with a total memory length of 5k samples. So processing time even with 4 quad core 3.6Ghz processors takes time to crunch those numbers. We also have the ability to divert performance from screen refresh update rate to pure raw number crunching with this scope like a turbo boost button lol So I set the scope to max power (lol) for precision. For the spectrum analyser I set the span from 10Hz to 1Mhz only to help show the harmonics at around the dc low level frequency ranges. We also have the ability to refine the RBW (Resolution Band Width) how close the sample points are taken during each sweep this was set to 200hz. A decent FFT would be around 1 million points @ 30Khz RBW do but having a much tighter RBW combined with more sample points 2M yesterday and 1 Meg points of memory depth each sweep was taking multiple seconds per sweep rather than nanoseconds. I deliberately set the FFT to give a greater resolution and therefore more accuracy. I could go much higher however the sweep times would be untenable |
|
|
|
Post by HD Music & Test on Dec 24, 2022 18:15:01 GMT
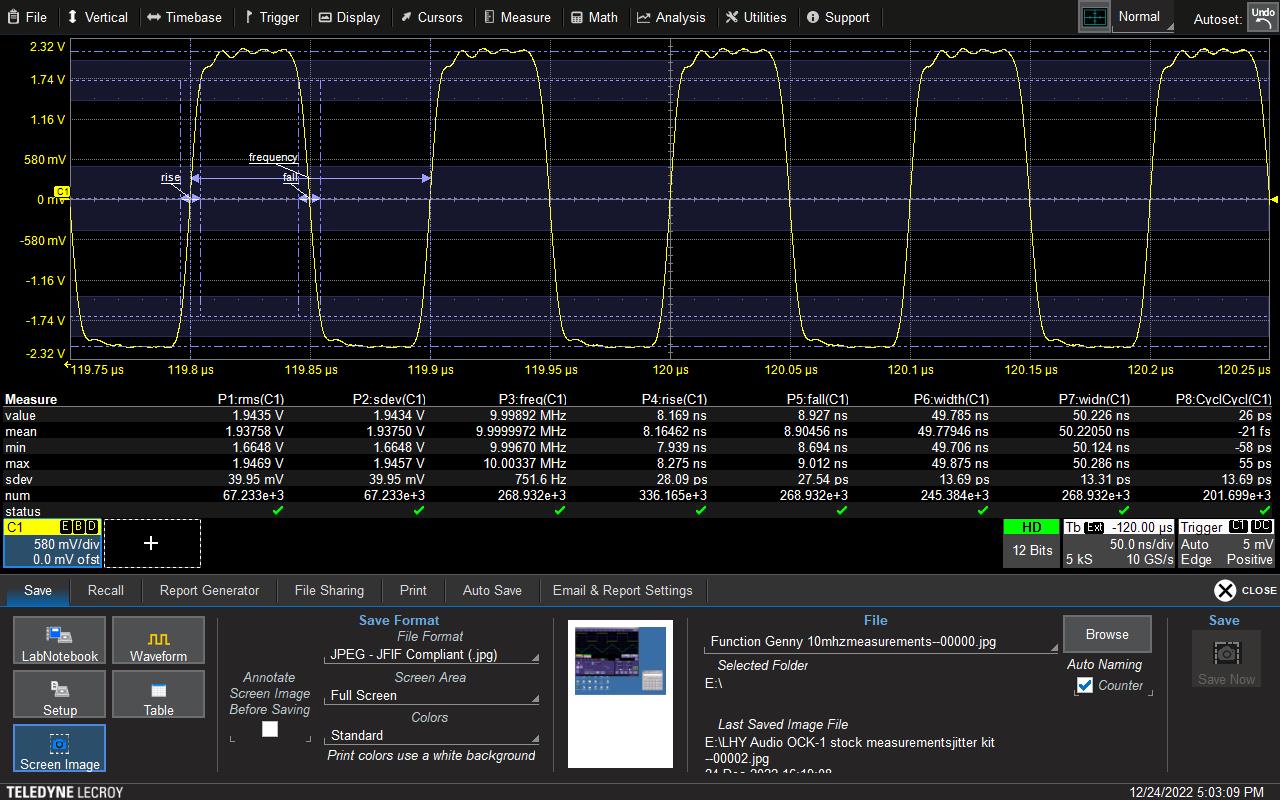
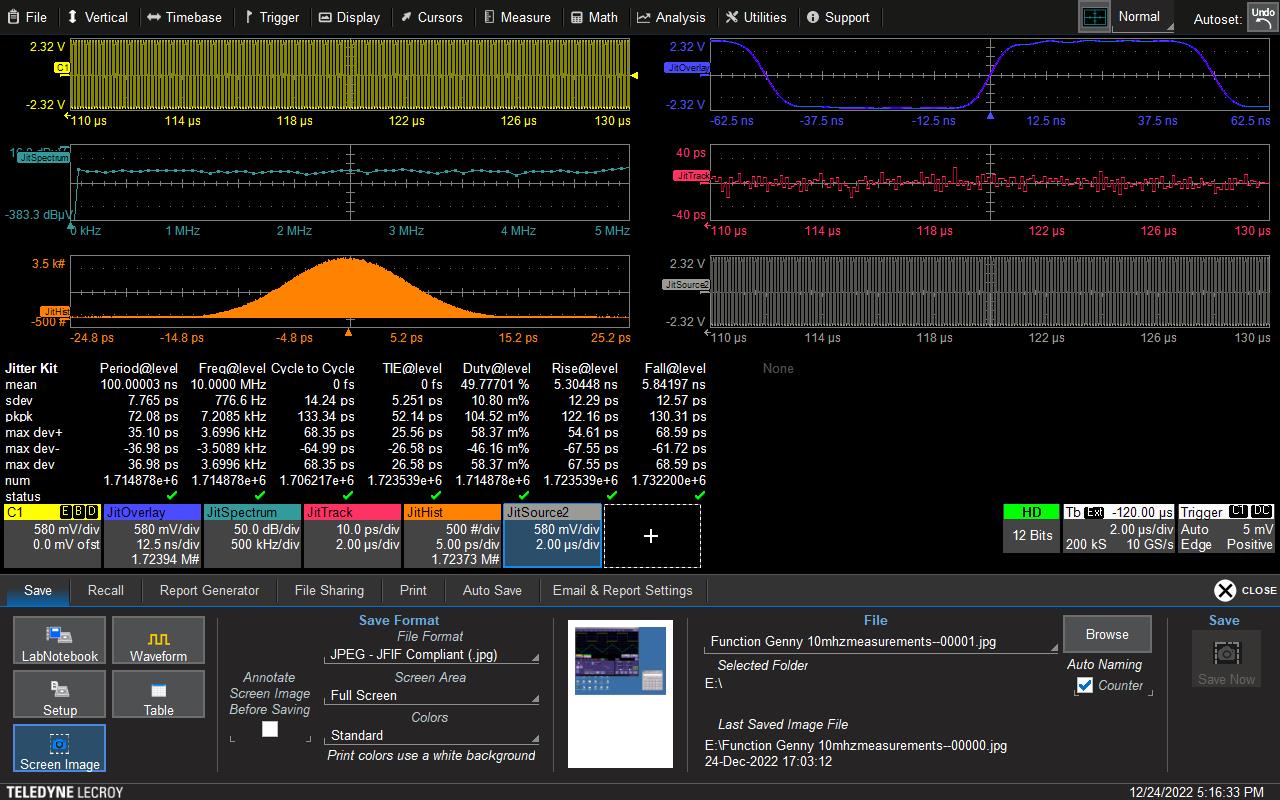
It’s been a wee while since I last placed some information on my blog, apologies we have been insanely busy of late, however today I'm going to cover a popular topic on TAS, aftermarket clocks. Today I'm going to give you pointers on how to look for the more quality sounding clocks and what exactly you should take into account when doing your research into selecting one for your system So are the stated specifications for various products REALLY delivering what they state, and looking for ultimate low phase noise @ 'X' and 'Y' frequency is this the holy grail or are they other factors at play here that determine / generate a more realistic indicator of how this will change the sound quality of your system. For example does a more straighter and cleaner looking rise time leading edge of the wave form change the perceived sound quality in any way? Conversely is having minimal ' Gibbs Ears' or overshoot on the posing tive width aspect of the wave form shape have a bearing at all? The overriding factors with clocks are believe it or not, not just the actual clock module itself, it the whole circuit everything including the cables you attach to the said device, we in EE circles call this the transmission line, the total pathway from a/c entering the box to the point of entrance onto the connecting device everything in this path-way has an effect, large or small and by effecting many different aspects of the clock generation process and changing many of the parameters that really mater in delivering a quality, ultra-stable, ultra-low drift timing signal that will produce positive differences in your system sound quality. So, let’s look at why you would wish to use an externally generated audio clock signal in the first place, after of the vast majority of audio dac’s (consumer) do not have the ability to accept a direct master clock feed frequency, I can only thing of seven brands off the top of my head right now. Compare that to the dozens of other makes which don’t. To do this we need to look at how audio data is transmitted between boxes and internally within an all in one CD/Dac unit. The vast majority use a form of serial audio data transfer which is called I2S (Inter IC sound) or pronounced (Eye Squared ‘S’) it is loosely based on another serial data format I2C although that only has two lines of data as opposed to I2s which has three layers which are Audio serial data / Bit clock / Word select clock. The word select (Clock) is for determining either left or right channel (1 or 0) low side for left AND HIGH SIDE LEADING EDGE FOR RIGHT. However it’s important is the overall timing of the serial data itself and we can use those, much touted word ‘Jitter’ So, the theory and model goes, the more faithful to the ideal square wave the better the result will be. The starter for 10 is this function generated 10 Mhz Square wave form as base line comparison for you, the FG used is decent 16bit model as you can see its not as most people would expect, (It doesn’t look perfectly square) Oddly enough SW don’t exist in nature per say, they are made up of multi different frequency sine waves and ‘bolted together’ All the measurements at this stage are taken with identical settings: real time sample rate is 10GS/s with a real time memory rate of 5Ks with a HTB (horizontal time base) of 50ns per division. This is the base line image for 10Mhz SWF generated by the function generator. For a good indicator look at the frequency variations from the 10Mhz signal (that 10 million hz) so a maximum deviation of 879Hz is a 0.00752% accuracy, so given the very large figure that’s a damn fine figure of merit. Bare in mind this is just a signal generator and not a high accuracy audio word clock device!
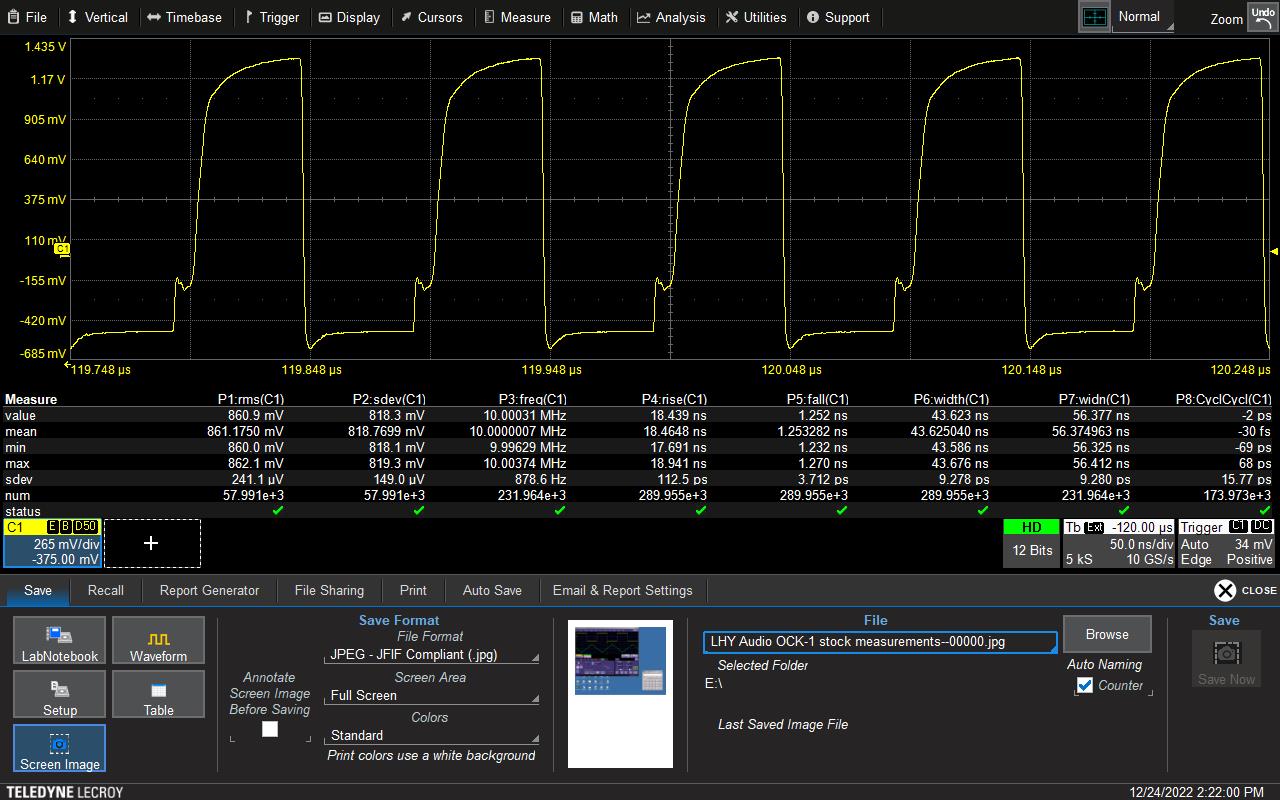
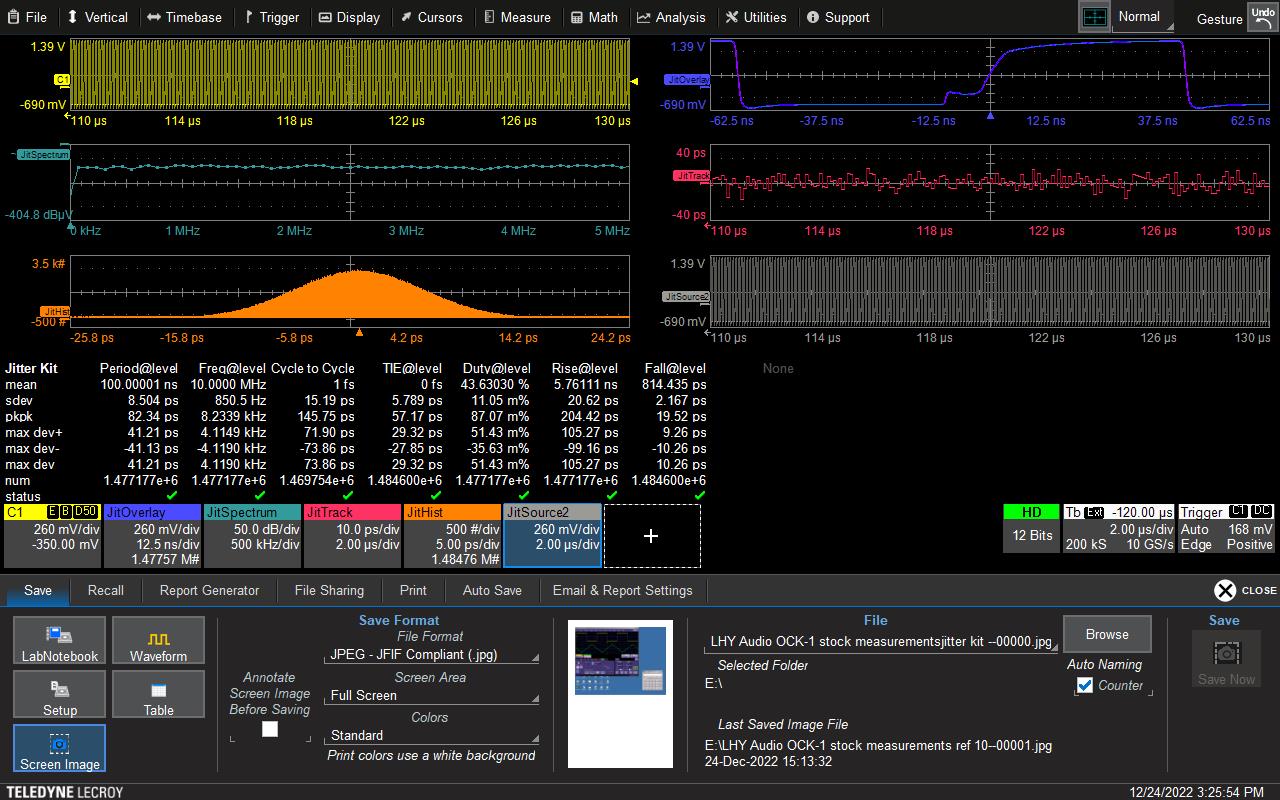
If we look at a current Influencer touted special 10Mhz clock we can see that it’s figure of merit for the same measurement article is 879Hz again a very good figure of merit this gives an accuracy percentage of 0.00879% again an excellent number. Take a look at the actual wave form itself, its quite distorted and mis shapen the square wave form is not of a standard I would expect.
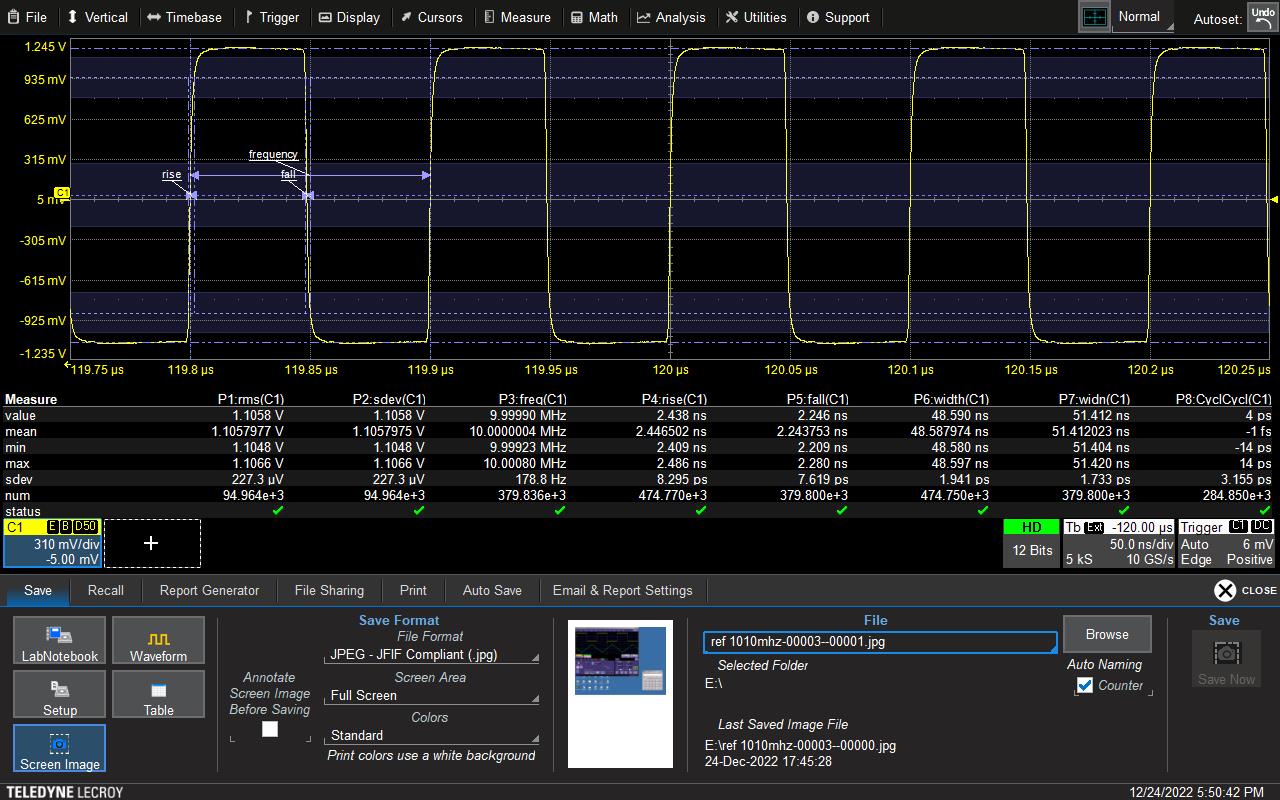
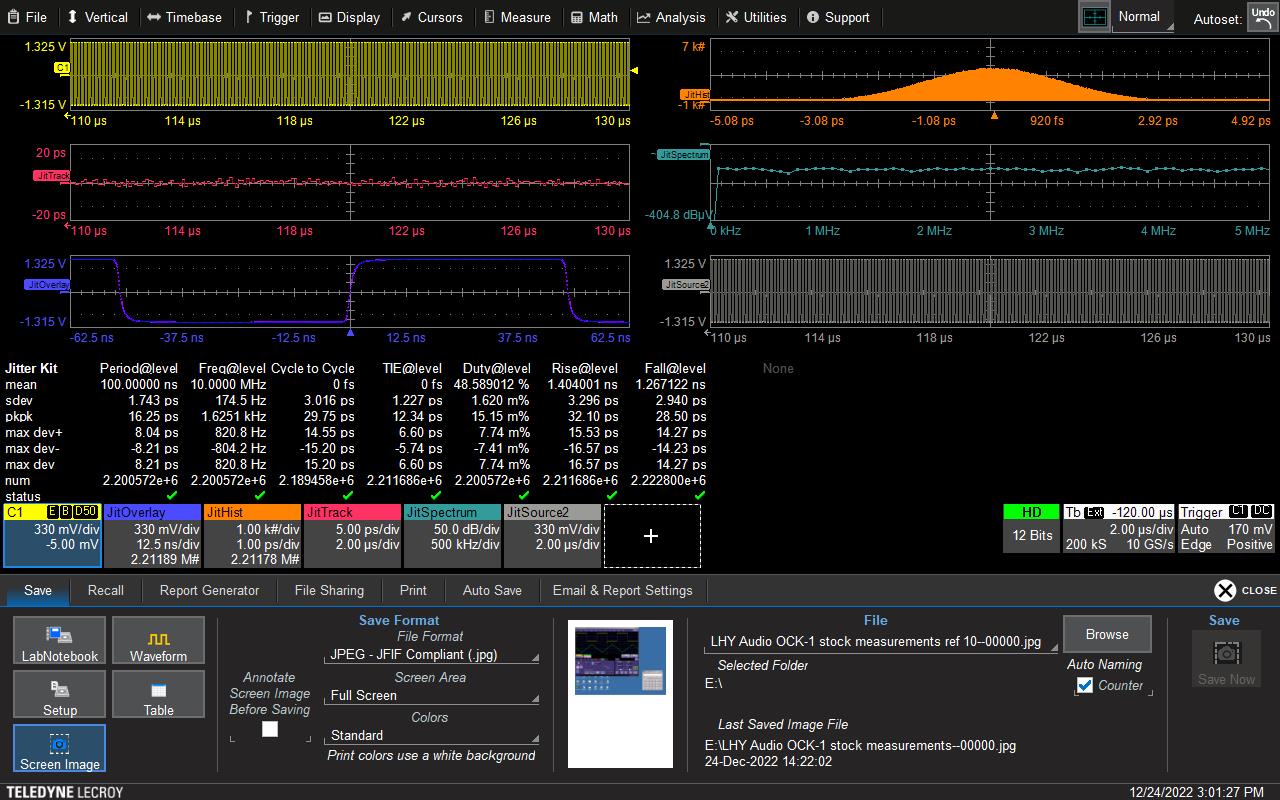
For a control sample a reference 10Mhz clock I use here in the lab to keep all of the test equipment on superior time base. Again the same settings used across the experiment, with at least 250K samples taken on each sample time. This unit has a total variation of 178Hz out of 10 million over 300K samples taken which gives a figure of 0.00178% quite something and around a factor of 5 times less deviation from the fundamental frequency! I have more accurate versions of this unit as well!
However does this tighter tolerance make a difference the end result?
Part two to follow shortly
|
|
|
|
Post by HD Music & Test on Dec 24, 2022 19:04:00 GMT
The measurements were taken with the same 50 Ohm T&M reference cable I use for all clock investigations has a Band Width of 18Ghz with an ultra-low insertion loss. Moving on to the next section of today's gripping instalment of to clock or not believe the 'hype' we look at a fully suite of jitter measurements for those three devices, this time the HTB is out to 2uS this allows the scope to acquire significantly more samples and a real time memory of 200K, real time sample rate is 10GS/s that’s 10 billion samples a second. First image is of the Function generator as in keeping with the base line reference. This section of the testing I took well over 1.5 million individual samples on each of the devices. A word clock has a duty cycle of 50% so half on and half off, the recorded Duty @ level here is 49.7%. The images show to left the incoming wave form with a HTB of 2uS (more samples taken in a set time period), below is the jitter spectrum analyser plot, as you can see very little in the way of harmonic noise. Bottom left 'the hump' is a jitter histogram which takes 'x' number of bins (lines of value) and inserts a point for each exact time slot and builds up a picture of the various slots (bins) as they fill up, this is single modal hump so it's in the deterministic jitter camp (a Bi model hump is in the random jitter camp) you can see the main jitter span from around -12.5 picosecond to around + 12.5pS its does extend out further but the number of items in each bin at the extremes of the hump is tiny. The shape and pattern is recognised as a good indicator of jitter performance. Top right is jitter overlay pattern which is extrapolated from the incoming channel one data stream it should closely reveal and identify with the same incoming stream if the HTB ws slowed down to match that show on that window (which it does) Under that is another useful jitter parameter tool used to indicate whether you are within your prescribed specifications. each one of those mini wave forms is above or below the centre line of indicated 0ps jitter (nothing with ever equate to 0 jitter as it’s not possible) however the closer those wave forms are above and below the centre line in relation to the centre line the better the measured jitter, as you can see the indicated 'swing' which is constantly moving is around +/-30pS so not too shabby! The bottom right window indicates a mirror incoming signal which I set as Jitter source two to show continuity although it is actually seeing the same identical signal as Channel one its alike a reality check when you are losing you mid through to much information lol
This is the image of the Infuenecer clock so as above bit with the readings that relate to that particular device, some areas the figures of merit are improved, however in others they are sahll we say lacking!
Finally the lab reference which as you clearly see is large step up right across the measurment spectrum.
Part three to follow shortly
|
|
|
|
Post by HD Music & Test on Dec 24, 2022 19:31:49 GMT
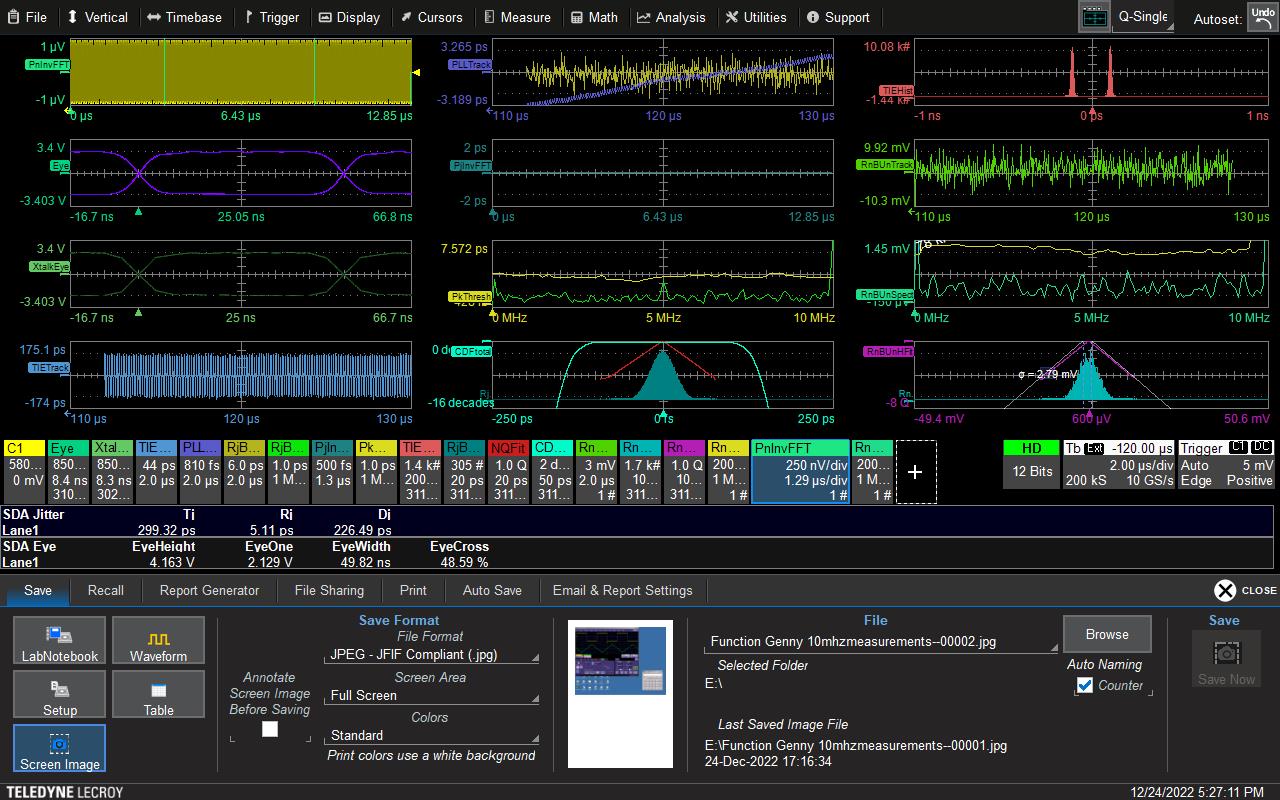
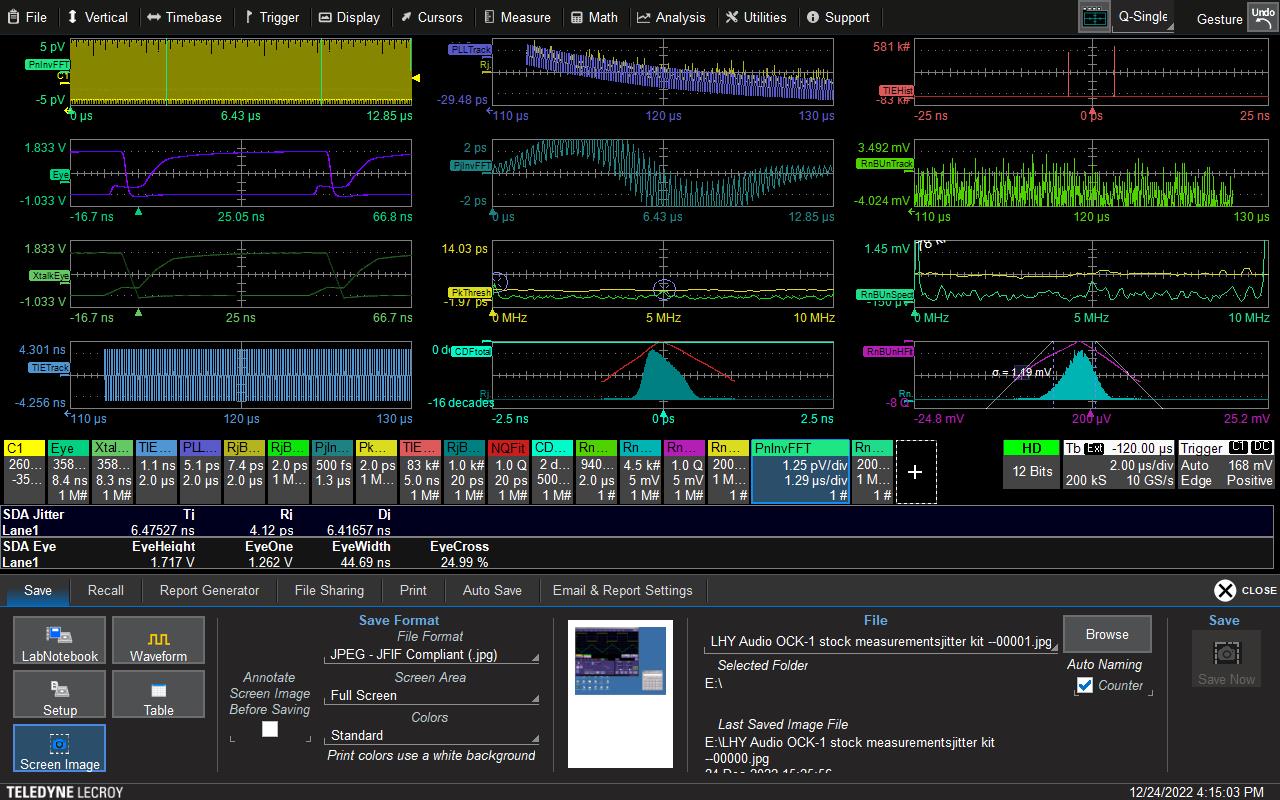
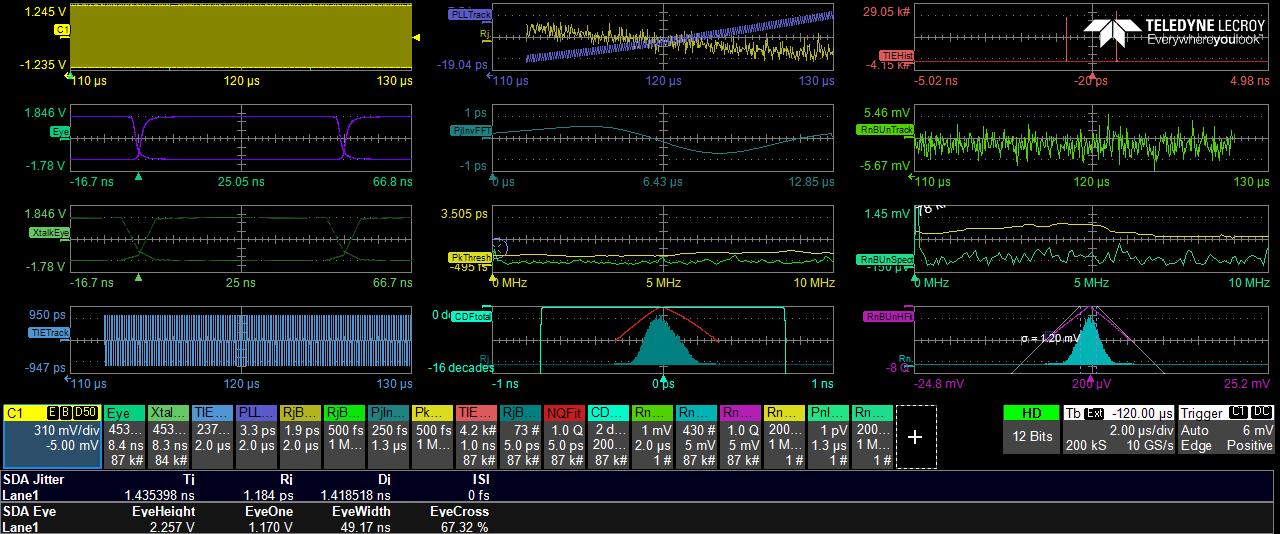
Forgot to mention the scope bandwidth was set to 200Mhz, with digitals scopes, like audio Nyquist theory is relevant here so at least twice the BW is required to view the frequency you are viewing. However, the higher the actual frequency you are viewing in general the more BW you need. So our 10Mhz square wave form personally I would use a 50Mhz BW setting on the scope, however for a more complete picture I am using 20 times the sampled frequerncy to ensure sufficient capability ofthe scope also the wave form has been adjusted to use the 12 bit ADC potential to the fullest as in the wave form is taking up at least 3/4 of the screen height. Last section of the investigations this is a full serial data analysis with eye diagrams, X/talk (digital noise measurement), PLL (phase lock loop track) which looks at the secondary reclocking scheme that many clock employ to improve performance is shown as a similar visual as the jitter track in the pervious post. Full jitter suite which is more in depth than the previous (but still cracking Gromit jitter kit) goes more in depth, can also extrapolate various other insertable (explanation later) clock models and programmable matlab (third party software you can programme your own formula’s and models and import into then scope) modelling / TIE (time interval error) plots, bath tub jitter indicators (yes really) eye opening and measurements plus we can ask the scope to calculate the BER (Bit error ratio) to sit inside the eye diagram to check if the 'PC modelled' eye pattern matches the real world result. It would take me a long while to fully explain all of the indicated window functions, which in all honest would bore you senseless, however these images are for the purpose of comparison just to show a real in depth breath of measurement abilities. they are also FFT spectrum plots of various different parameters etc. The eye patterns should be clean and open and cross evenly and look like an eye shape. If anyone wishes to ask questions then no problem.
Next the influencer clock results, note how the CDF historgram (lower middle window) is skewed to the left compared to the prevous screen shot, does this single factor make any difference?
Last up the lab reference I have also included the ISI measurement which is Inter Symbol Interferenec put put simply crap programming or bad interconnect pathways.
Next installment will be ethernet cables / filters/ and reclockers going really indepth on this topic as its one I get ask the most about, to follow that USB cable and filters.
|
|
|
|
Post by MartinT on Dec 24, 2022 19:46:35 GMT
Thanks, Tony, a lot to absorb there.
Can you make any general assumptions about the merits of sine and squarewave clocks? My personal experience is that I have always preferred sine clocks since I started playing with them, but that may just be me.
|
|
|
|
Post by stellabagpuss on Dec 25, 2022 8:28:29 GMT
Wow, a lot of information Tony but a great gift to TAS.
And even if not immediately read,l sure it will be a great reference point.
|
|




 (though NO blue lights!)
 Its also very accurate and stable plus has a four wire ability to make even tighter measurments when required it also has a temprature feature as well.
